When our stores open on Thanksgiving day, we see an API traffic spike that is 10x our normal load. To ensure our systems are up to the task of handling the burst, we need to go beyond the typical load tests run as part of our continuous integration pipeline (someday we will write about our continuous performance testing!). Black Friday traffic requires a unique load profile and it requires all of our APIs to be tested simultaneously.
Around this time last year, me and two of my good friends on Target’s API team locked ourselves in a corner office for two weeks with a single goal: ‘Load test the sin out of our entire API platform to ensure we don’t experience a single incident due to traffic volumes throughout the holiday season’. We were 100% successful. These are the things we did that contributed to our success.
We structured our test plans in a way that made sense
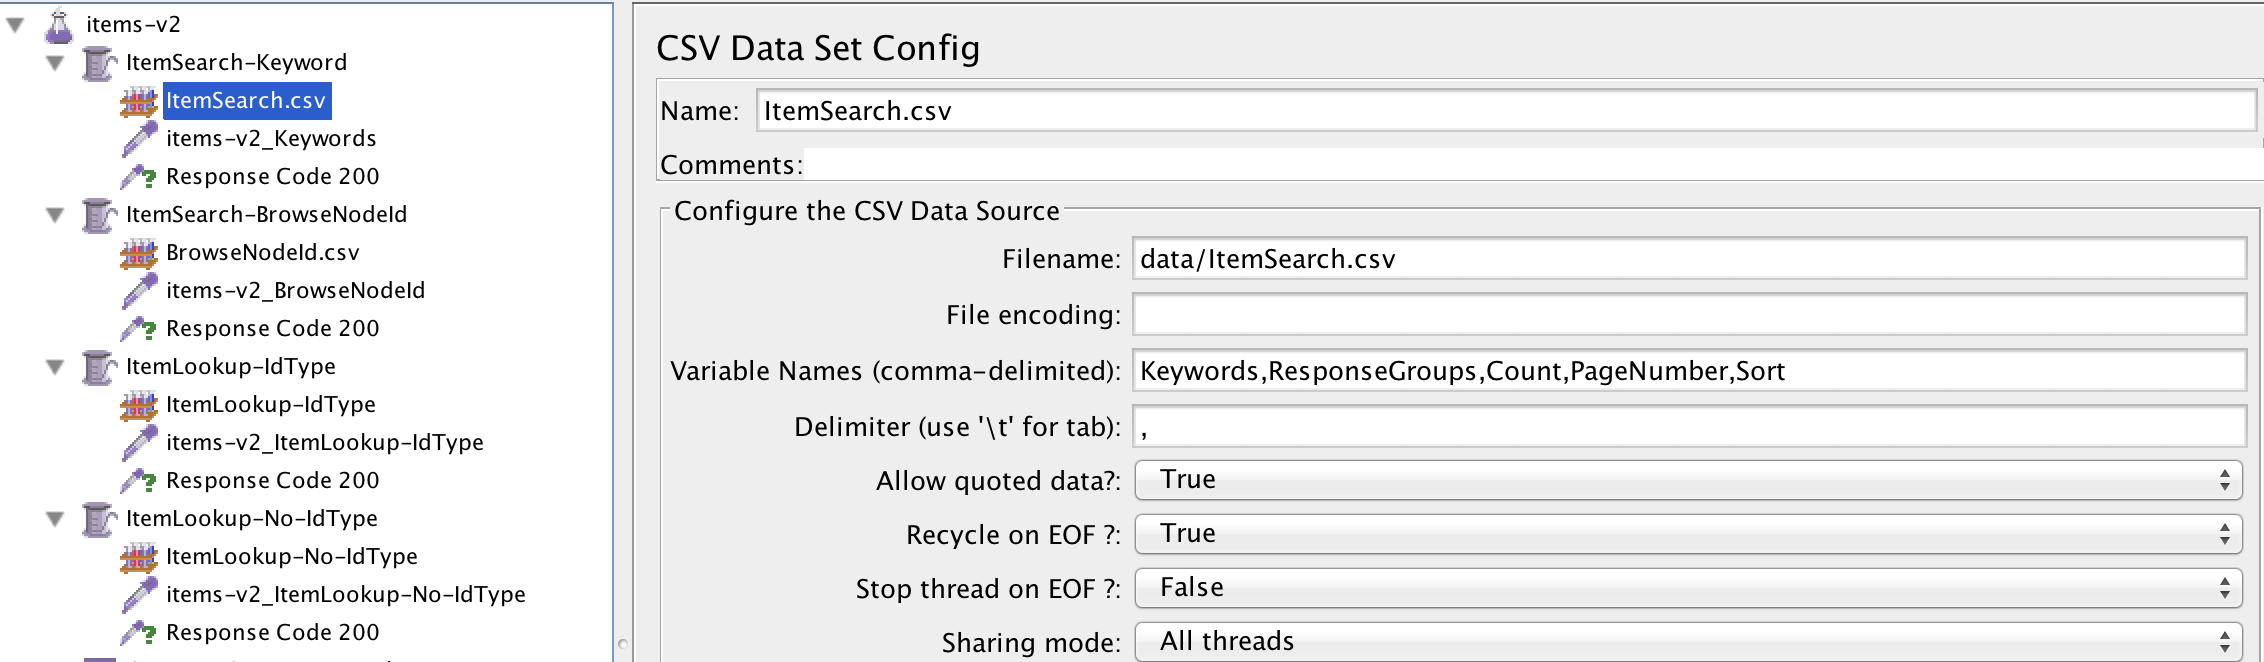
Because we were testing APIs it was relatively easy for us to logically break out our test scripts. Each API (e.g products-v3, locations-v2, etc) had a standalone script that contained the load profile. Any test data necessary was kept in a sub directory called “data” and referenced using JMeter’s CSV Data Set Config config element.
Example of a basic test plan for our items API:
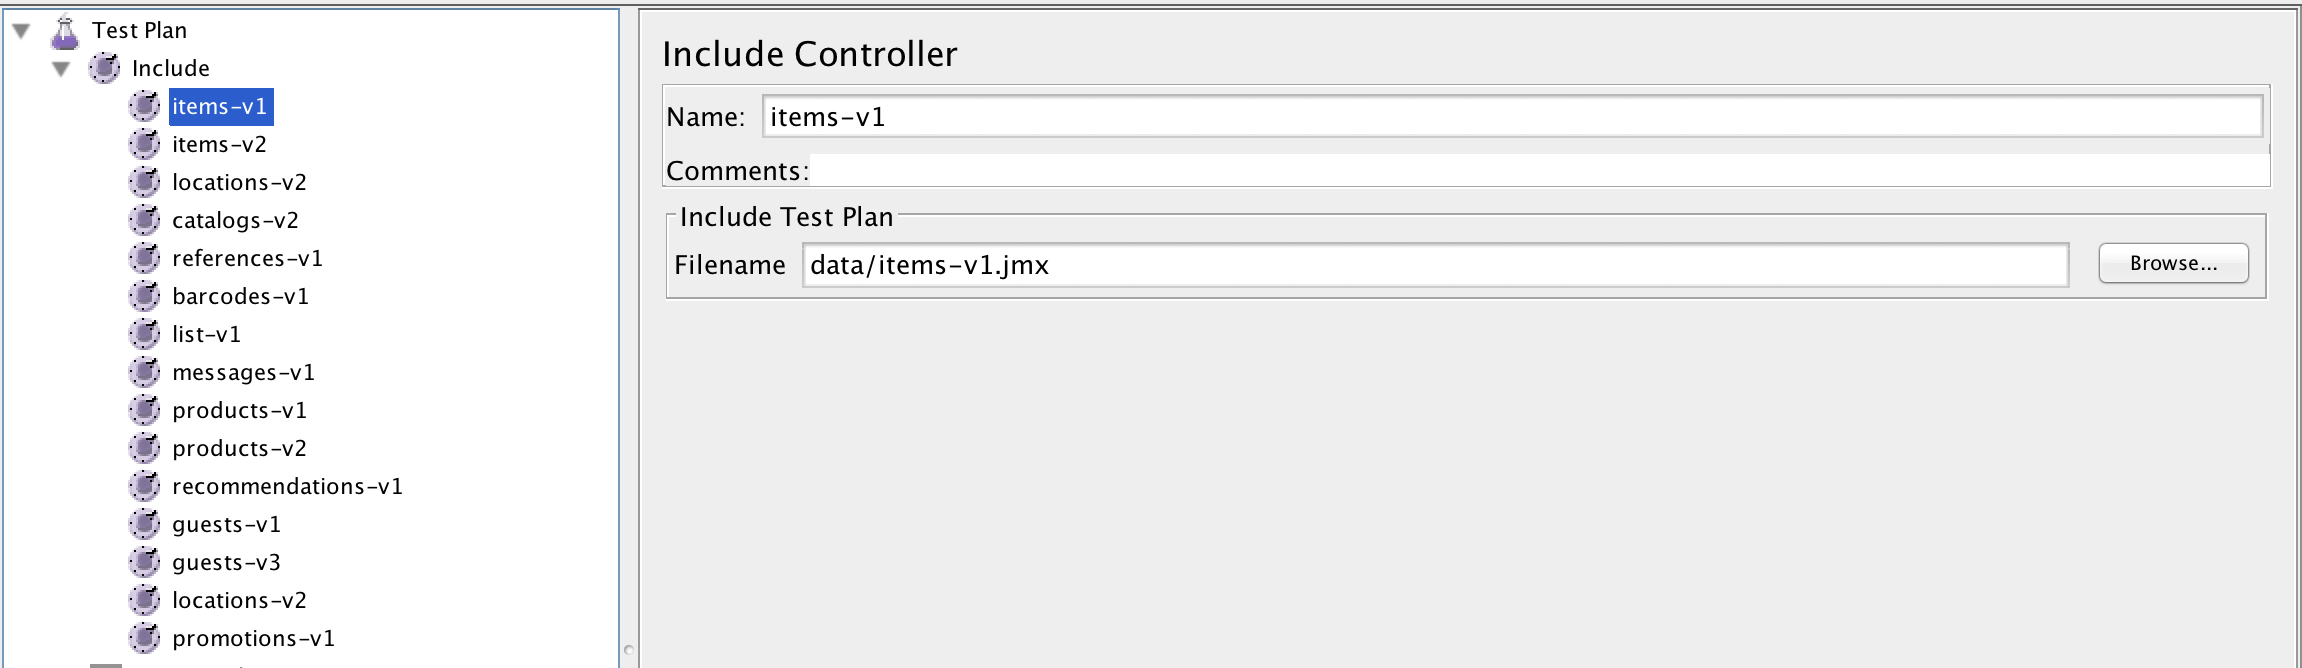
We then created a master script that consisted solely of JMeter Include Controllers. This made it extremely easy for us to modify our test approach on the go. For example, in one instance we found a bottleneck in our APIs that use OAuth. It took less than ten minutes for us to modify our master script to include only OAuth specific APIs.
Example master script:
We leveraged the JMeter plugin community
If you use JMeter and are testing APIs, install the “Extras with libs” plugins at jmeter-plugins.org The plugins provide some excellent utilities for working with JSON.
We used a version control system (we prefer git/GitHub Enterprise) to track changes and collaborate on our test scripts. We committed early, and committed often. Also, pull requests make it dead simple to review each other’s changes.
Not much more to say on this one. Common sense.
We built our test profiles from past production traffic
When building out load profiles for each API, our initial plan was to ask our API consumers what they expected traffic volume would be. It turned out that this approach wasn’t as good as we first thought it would be. There are many consumers across our APIs and there is a significant amount of coordination that needs to happen for this approach to work. Even in instances when we did receive estimates from consumers, we often found that we were in a better position to estimate usage than they were (they weren’t logging and aggregating all of their API requests, we were!)
Here is a simplified version of the method used to estimate consumer traffic:
- Find the max average transactions per second over a 60 second period, per API, 4 Sundays before last Thanksgiving
- Find the max average transactions per second over a 60 second period, per API, last Thanksgiving day
- From those values come up with a per-API multiplier
- Find the max average transactions per second over a 60 second period, per API, 4 Sundays before this Thanksgiving
- Apply the per API multiplier to each API (we included a little extra cushion too)
- For those of you familiar with Splunk this is the query we used to calculate the maximum average transactions per second:
index=target_apis Environment=prod | bucket _time span=1s | stats count as TPS by _time API | bucket _time span=1m | stats Avg(TPS) as max_avg by _time API | stats Max(max_avg) by APIIt turned out that real traffic was a great predictor of real traffic. Our estimate ended up being quite close to actual traffic on Thanksgiving.
One important caveat: Solely using historic traffic to predict future traffic does fall short in one obvious scenario: A net new API consumer coming online that is going to drive significant volume. Net new estimates are always difficult and they will fluctuate as your API consumers learn over time. You’ll want to talk with your consumers as they onboard to your API!
Kept it as simple as possible
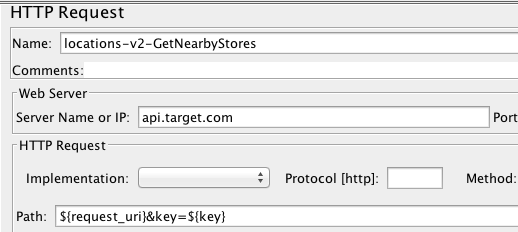
Don’t overthink you load profile. If you have a resource that is 100% reads (e.g. safe and idempotent GETs), just replay actual production traffic. For example, one of the most frequent uses of our Locations API is finding nearby Target stores. Rather than take the time to analyze how many people pass in parameters for zip codes, vs addresses, vs lat/long coordinates; we searched through our logs and pulled the last couple hundred thousand requests that had “nearby” as a query parameter. All we had to do was replay those requests and we could be extremely confident that the mix we were getting would reflect actual future load.
Our nearby stores test consisted of a single http request sampler that cycled through a Splunk extracted csv data set config of thousands of requests pulled directly from our production logs. This was all it took to set up a test that mimicked production traffic to a “T”!
I’ll say it again: Real traffic is a great predictor of real traffic.
We distributed load
Our APIs are built on geographically distributed systems. The end users of our apps are geographically distributed. In order to accurately test we needed to drive geographically distributed traffic. Using the cloud, we were able to quickly spin up traffic in a highly automated fashion.
We captured metrics about everything
I think we can all agree that running a performance test without capturing meaningful metrics is relatively worthless. In order to take real action after our tests we needed to capture data at each of the layers of our API stack.
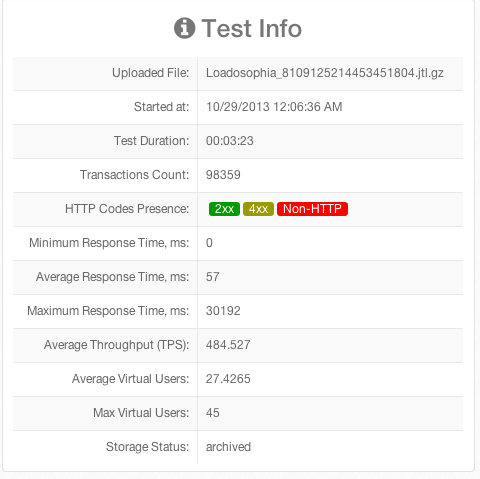
Client metrics (in this case our client was JMeter):
The big 3 client metrics for us are response time, error rate, and throughput (we look at each of these through a number of lenses). We used Loadosophia for JMeter reporting. They provided dozens of insightful views into our tests in near real time. I won’t reproduce every Loadosophia generated metric here, but will provide you with a glimpse of what their simple summary report looks like:
API Gateway metrics:
We capture numerous metrics around our API gateway in conjunction with our API gateway provider. The first metric I look at is gateway processing time. If I see any issues there, I work with our API gateway provider to dig in to infrastructure vitals and identify bottlenecks.
API metrics:
For the most part we try to minimize the logic that we implement at the gateway. The guts of many of our APIs lay in thin Grails applications that sit behind our API gateway. We gather the similar metrics at this layer as we do at the gateway layer.
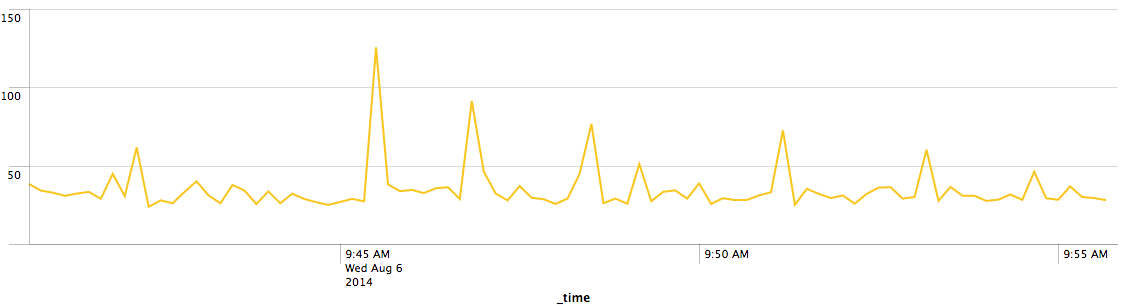
Example chart of 95th percentile Grails processing time in milliseconds:
Backend metrics
The backend across our APIs are extremely diverse (they range from legacy Mainframe to Cassandra). Capturing metrics at this layer is toughest for us given the diversity in technologies, but we do everything we can to get the appropriate monitors and/or logging in place on all of our backends.
What is next for us?
We are currently gearing up to for our 2014 holiday season testing and hope we are as successful this year as we were last. We are going to use many of the same methods as we did last year but we know we want to try to make some improvements in the future. The biggest improvement I want to make is to leverage something like jclouds to build a cloud agnostic tool for generating load with JMeter. It would be excellent to be able to spin up traffic that originates from our internal OpenStack or Google Compute Engine. If I am able to carve out the time to develop this, I will share the code here.
Some interesting numbers
- Our estimated traffic ended up being higher than we actually experienced on Thanksgiving. If we hadn’t included cushion in our estimates we would have been very close.
- We ultimately tested our APIs at double what we thought our peak load would be. Better to be safe than sorry.
- We made it through peak without a single major incident on our API platform.
- It took three people two weeks to write 19 test scripts and build out our testing platform.
- We uncovered a number of scalability issues throughout testing. If we hadn’t been as thorough as we were, we would have experienced production issues on our busiest day of the year.