We have been using Cassandra in production for about a year now. We use it to serve up product and inventory information through our Products API. Currently, we have a 12-node Cassandra cluster. Each node is a physical server with a 24-core processor, 400gb RAM, and 12 SSD hard drives.
Overall, Cassandra has been very stable. However, we ran in to some interesting tuning problems recently - mostly because of our inexperience with Cassandra. I will go in to the areas we had issues with and what we tuned to fix them.
Problems we had
As we started performance testing for peak (see Aaron Strey’s great blog post) we got to the point where Cassandra was our bottleneck. We knew something was wrong; our servers should have easily been able to handle the volumes we were sending. As we looked into the specific issues, we found a few interesting stats about our responses from Cassandra:
- Reads were hitting 10+ SStables each time
- Tombstones per slice were almost triple live cells per slice
- The nodes would OOM frequently when compacting a specific column family
- New generation garbage collection was happening 20+ times a second, even when Cassandra was under tiny load
As time went on, performance degraded to the point where we were unable to run any significant performance tests, and it seemed like the cluster was “just getting by”. We were having to restart nodes frequently to clear the heap. This was not an option to continue doing, especially pre-peak when we expect nearly 10x the traffic volume.
Tuning Cassandra
After researching the issue, I came up with a hypothesis. I knew from prior issues one of our column families had a lot of data in it (it’s our biggest column family, it was around 200GB.) We delete (and upsert) this column family frequently, so I knew there would be tombstones. We had issues with this column family before - nodes would OOM specifically while compacting SStables from this column family. We increased the heap to 16GB in order make it through these compactions and it helped for awhile. After a few weeks, we started some preliminary performance tests against Cassandra for peak season. We blew the heap right away, and garbage collection started to pause the nodes for 10 seconds plus at a time. It seemed that the large heap size was hurting because of how long garbage collection was taking.
Watching garbage collection stats, I could tell that Cassandra was loading lots of data into the new generation. I knew that it was a big column family but Cassandra seemed to be loading much more data than I would have expected. What I discovered is that Cassandra was reading a lot of tombstones each time, and this was putting lots of extra data on the heap. This would just snowball when the cluster was under load, and blow the heap. I also noticed that there was a single SStable on almost every node that was around 85GB - about 40% of the size of the whole column family. This meant that specific SStable wasn’t getting compacted ever - and tombstones wouldn’t get evicted since it never got compacted. I realized we had way too many tombstones, and Cassandra was running out of memory trying to read them all.
Once I decided it was tombstones causing the issue, I was able to make some changes to Cassandra.
Leveled Compaction
By far, the most important change I made was switching from size tiered to leveled compaction. A good overview of leveled compaction is here. One issue I noticed when converting to leveled compaction is that Cassandra wanted to write all the temporary SStables to the same data directory - rather than splitting them across our 12 drives. Fortunately, our drives had enough space after running manual compactions against the large SStables that this wasn’t an issue. This was done using jconsole and the org.apache.cassandra.db CompactionManger to force a user-defined compaction. This cleared out enough tombstones to let leveled compaction finish. Once it was converted fully to leveled compaction, Cassandra is doing a good job of spreading the data across the 12 directories.
gc_grace_seconds
Since we had so many tombstones, I wanted to be more aggressive about when they would be cleared during compaction. I lowered gc_grace_sconds to 86400, or one day. This tells Cassandra how long to wait before removing a tombstone during compaction. Since our cluster is relatively small, and we fix any issues as quickly as possible, I’m comfortable that we won’t see any ghost data with this setting. I made this change on any column family that we generate a lot of tombstones with.
Tuning the heap
The next thing I did was look at the heap, specifically the max heap size and new generation size. The heap was already at 16g, and I kept this the same. This is still pretty high, but with the size of our servers the CPU can handle the garbage collection. I would like to lower this down at some point but need to do some more monitoring of the heap usage. I also increased the newgen size to 1200m, to make sure we weren’t collecting too frequently under load. I did want to make sure I left enough newgen size for reading lots of wide rows. I am continually monitoring garbage collection to make sure I don’t see long ParNew pauses.
Garbage collection logging
Cassandra offers a very easy way to turn on gc logging. I uncommented the gc logging lines in cassandra-env.sh. This gave more information on what was actually in the heap when it ran out of memory, and showed me that ParNew was the culprit in terms of slowness.
Tuning compactions
Since I enabled leveled compaction, compactions happened much more frequently. I wanted to make sure this didn’t overwhelm the heap like before, so I made some changes to compaction.
I set the following to limit compaction:
concurrent_compactors: 8compaction_throughput: 60
I also made sure multi-threaded compaction was disabled in cassandra.yaml.
Results
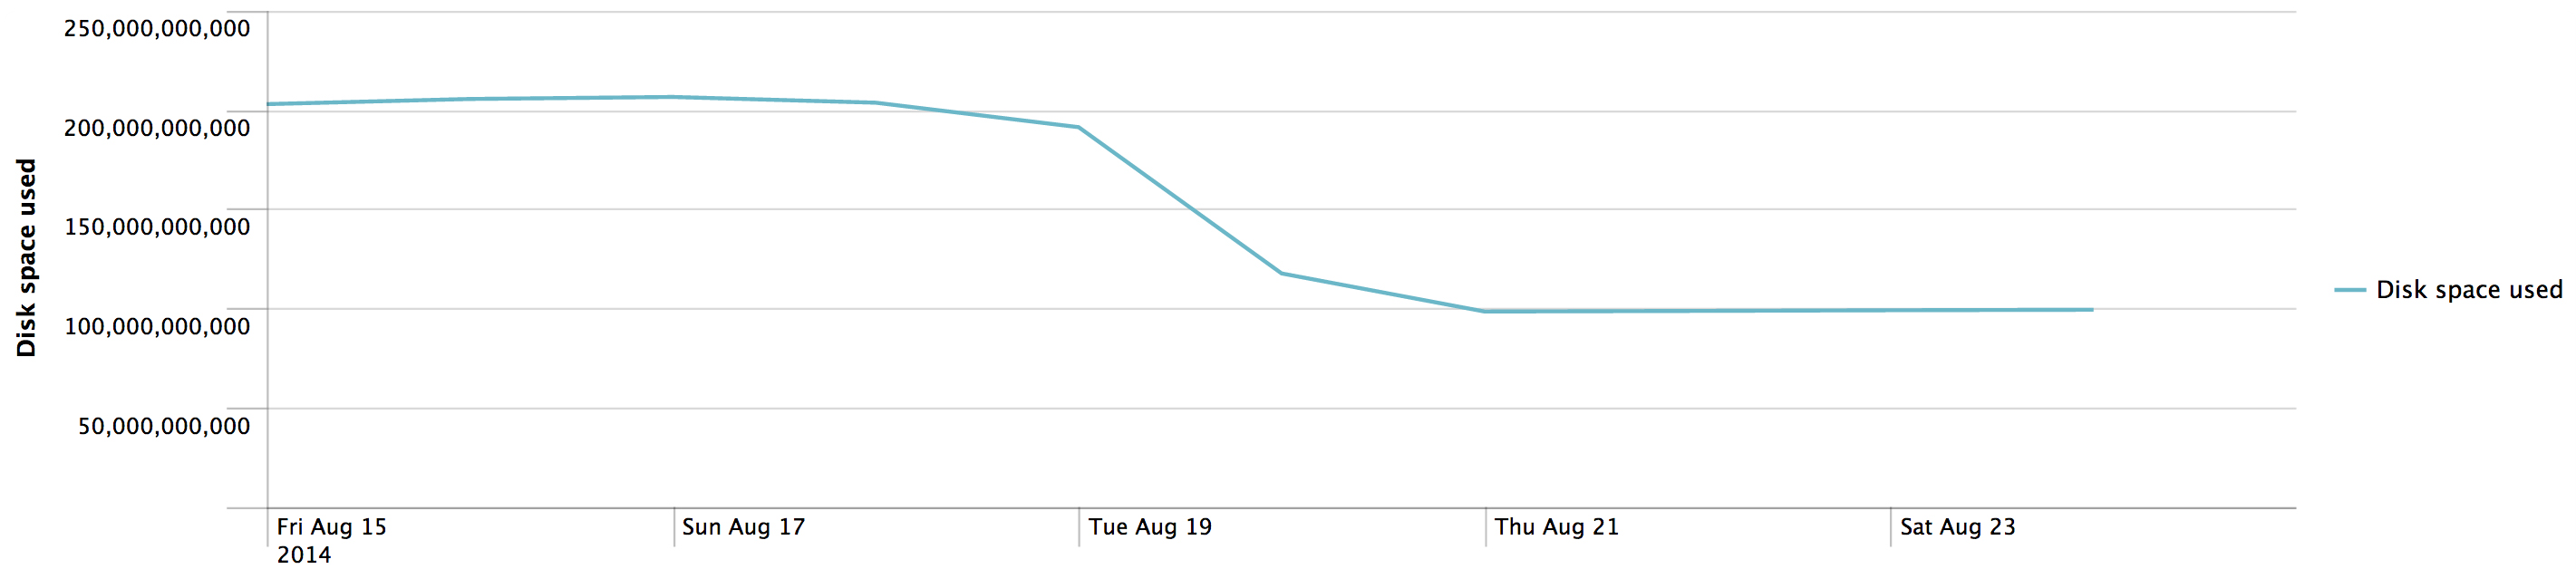
The biggest change was the amount of data each node contained. Each node went from 200gb of data to around 95gb for the problem column family. That is a huge difference, and means that our nodes had over 100gb of tombstones each.
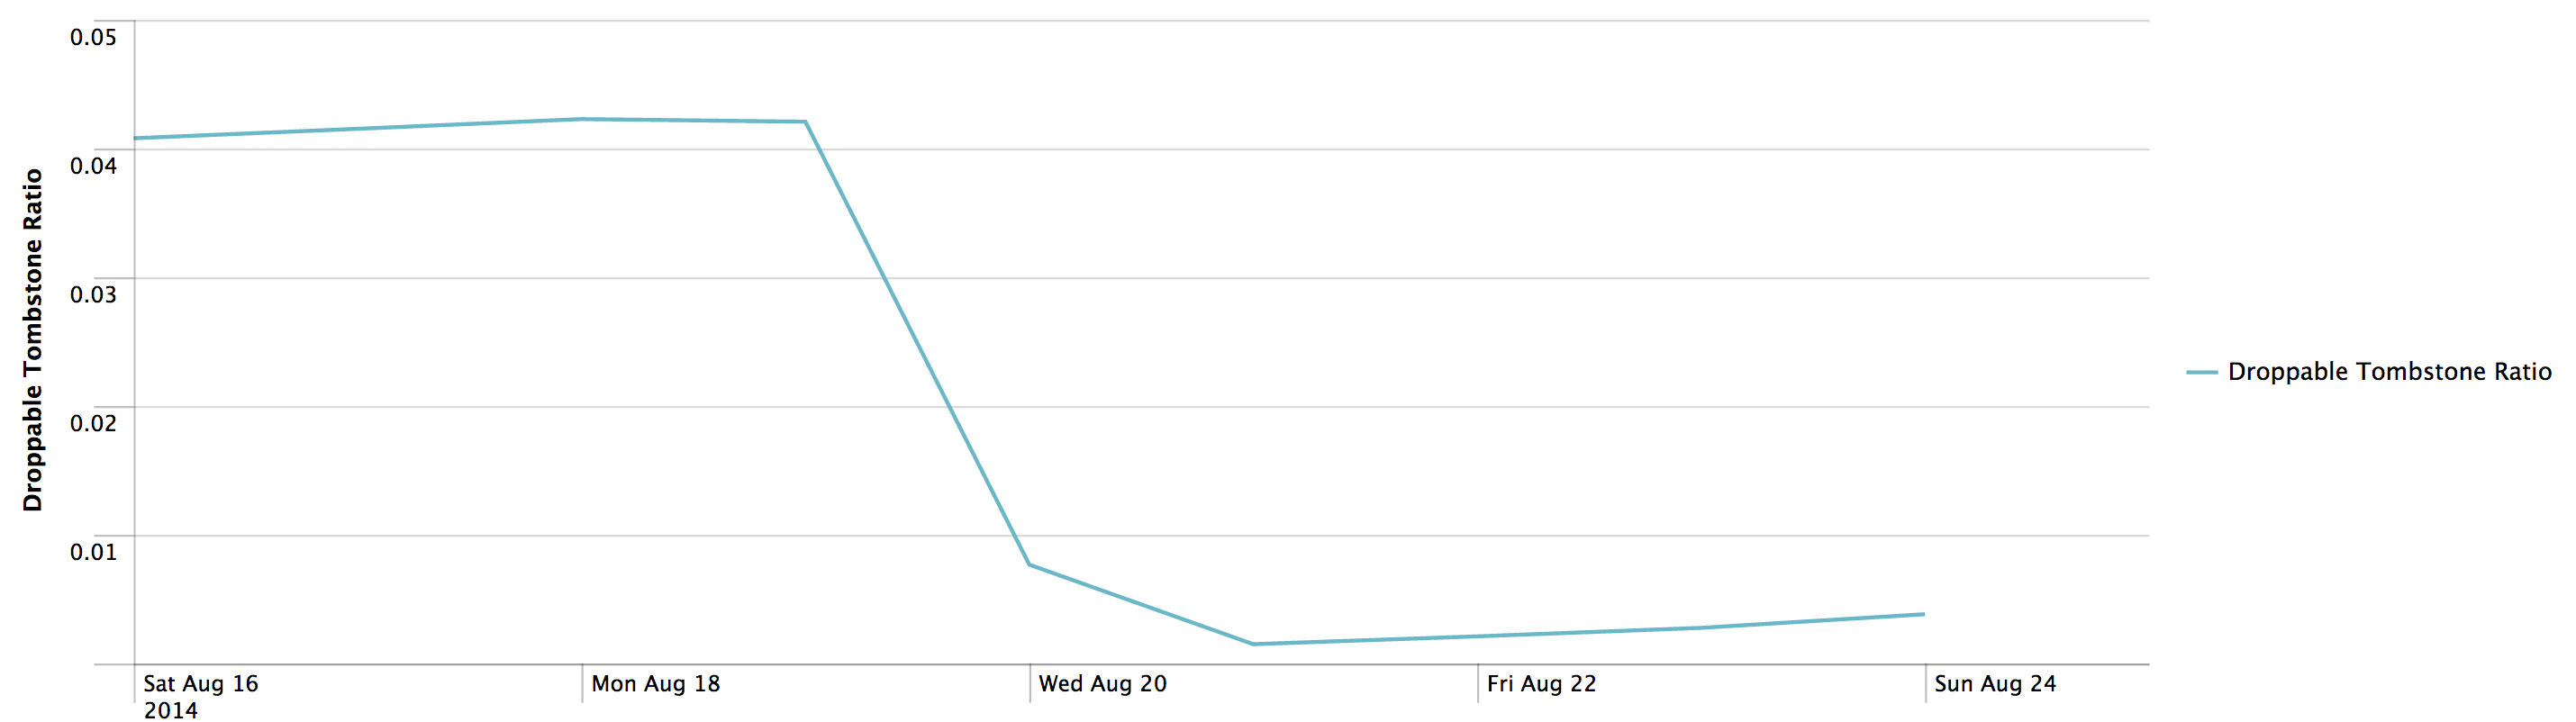
The droppable tombstone ratio went from around .05 to .005, and tombstones per slice went from ~10 to effectively 0.
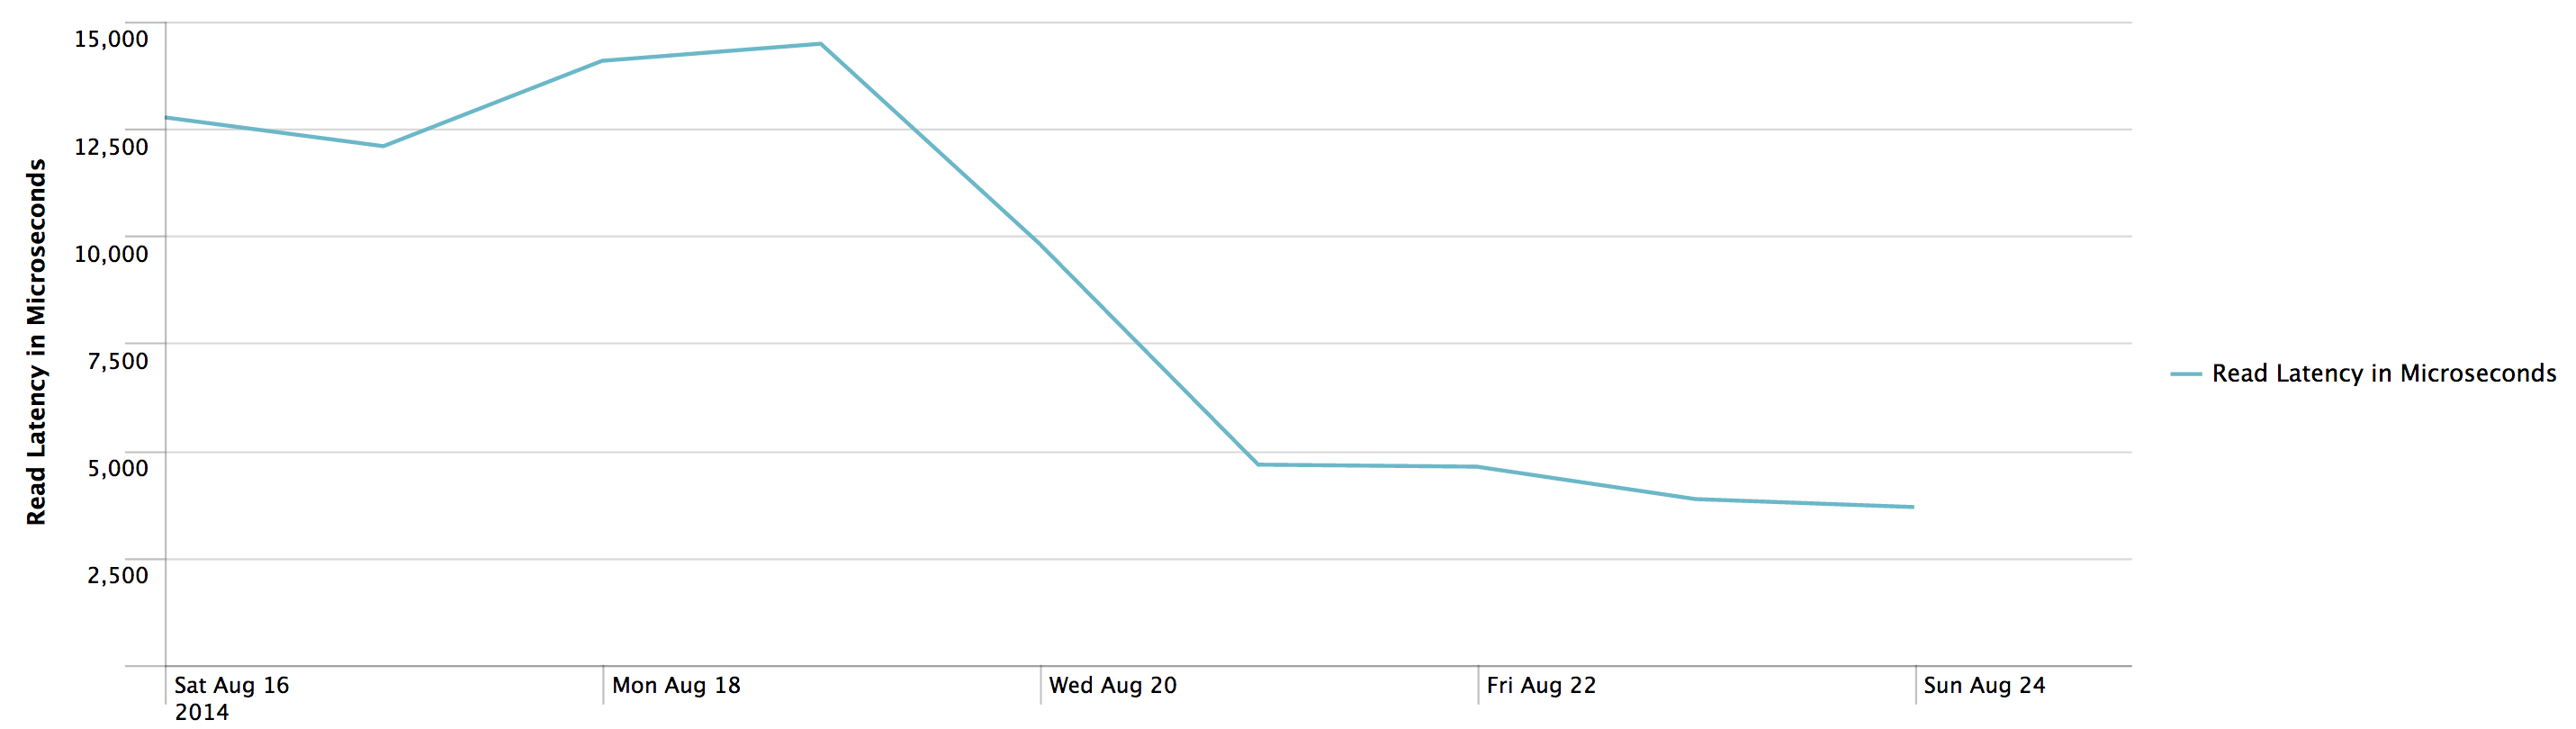
Read latencies went from around 15ms (much higher under any load) to around 4ms for the specific column family. The graph below is from tiny load with the load tests filtered out, as they caused Cassandra to run out of memory.
We have successfully been able to run performance tests against Cassandra with these changes, and Cassandra is performing much better. The performance load is barely noticeable and reads actually get faster now (the cache is able to work properly).
Tools I used
In order to diagnose these issues, I used a variety of tools. We forward Cassandra’s JMX logs to Splunk using the Splunk for JMX addon, so we’re able to see all Cassandra’s mbean stats in a format we can graph over time. I was able to graph tombstone information and see this information on a per-column-family basis.
To monitor the garbage collection, I used jstat. Jstat’s gcutil option worked great for me to see an overview of what was happening in the JVM.
Here’s an example of the jstat command I used:
jstat -gcutil -h10 -t $pid 250ms 0
The -h10 means print the header every 10 lines, this makes it easier to matcht the columns.
Here’s an example of the jstat output:
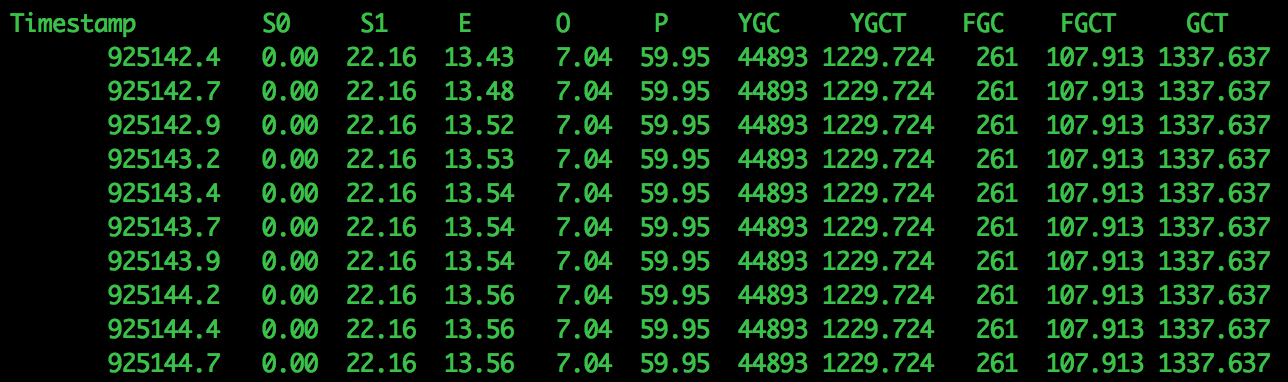
Jstat showed me that minor collection times were happening 20+ times a second, and under load stop-the-world collections were happening frequently. These would cause app pauses of 10 seconds or more.
The last tool I used was Datastax’s OpsCenter. OpsCenter was very helpful in providing a high-level view of how the cluster was behaving.
When testing some of these changes, I would make the change on a single node in the cluster and then compare that node’s performance with the others. The big change was the switch to leveled compaction, which was something that was all-or-nothing. I did do some write sampling to make sure the nodes could handle the load, but there was no guarantee until making the switch.