Recently we launched Project Argus, a 30-day “monitoring challenge” to improve visibility of key performance indicators (KPIs) across our technology stack prior to our peak retail season (in Greek Mythology, Argus is a 100-eyed giant). This effort was structured as a mix between a FlashBuild and agile. We used two day sprints, twice a day stand-ups, and feature tracking through Kanban boards. Quickly in this effort we decided to build our product as monitoring-as-code. Through the use of tools such as GitHub, Chef, Kitchen, Jenkins, and Ruby, we were able to quickly build several monitoring and dashboard solutions for use within our Technology Operations Center. These dashboards and the iterative process we use to continue delivering more content have been embraced by our support teams who now heavily rely on them to proactively detect and resolve issues.
One deliverable from Argus includes a cookbook per core business function that represents the KPIs identified by each business product owner. When run, the cookbooks establish connections to our data sources, build the scripts that process our data, and create crontab entries to automatically run the scripts at our predefined intervals. All of these resources and actions are defined in code.
We designed our solution so that the dashboards are decoupled from our centralized processing and metric creation. Additionally, our cookbooks are written to be dashboard agnostic and independent so that anyone can make changes to the appearance and we can switch dashboard solutions easily. The processing of our metrics is centralized and managed on-site with each cookbook receiving its own server. Finally, our dashboard solution detects lapses in data and generates alerts that post into our persistent chat client. This allows us to close the loop on the health of the monitoring system, which can be a painful endeavor!
##The Problem
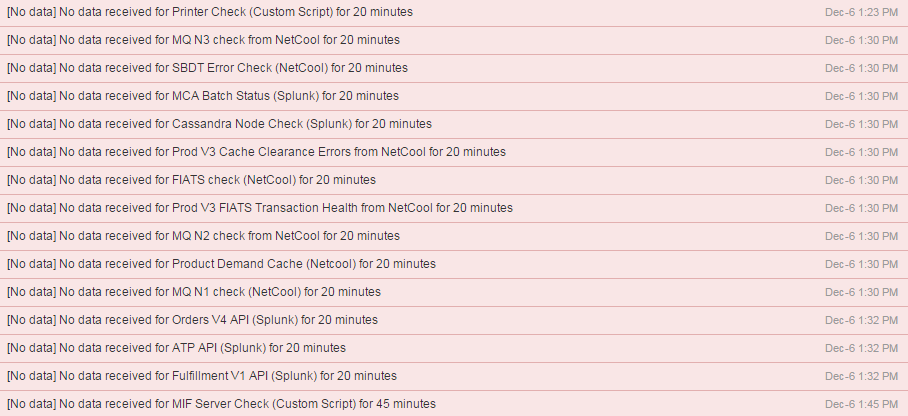
Unfortunately, on 2014-12-06 at around 1:30pm the servers we use to process the monitoring data went down without warning. The dashboards our support teams had grown accustom to using were completely blank.

Within a few minutes, our dashboard solution started alerting of missing data. Our health monitors worked!

I greatly enjoy cycling; at the time of the outage, I was at a volunteer event for a non-profit organization called Free Bikes 4 Kids that donates bicycles to families in need. This meant that I was unaware of the outage and the alerts that were being generated. At around 2:00pm I was notified of the outage and I was able to verify that our dashboards were blank through my phone. Luckily, I was just wrapping up my volunteer shift and made the 20-minute trip home to where my laptop was located. When I arrived at home, a quick check revealed that the servers were not responding to pings or SSH requests. What could I do to restore functionality to the Operations Center during our busy Holiday season?
Automate! Rather than continuing to troubleshoot the issue, I realized that using our automation tools would provide the fastest recovery.
##Automation Saves the Day
Since we are only processing monitoring statistics, I knew that I would be able to process the information from my development machine without any problems. Additionally, I had been working on the code earlier in the week and already had the most recent copy of one cookbook downloaded. With all of this in mind, I used Test Kitchen to build a new Vagrant box and install the cookbooks. In about 10 minutes I had a new virtual machine built with all of our scripts installed and configured. Within a few more minutes the associated dashboards were once again displaying data and the alerts automatically updated to the recovered status.

By 3:00pm – an hour after being notified (including travel time) – the VM running my local, up-to-date code had recovered half of the dashboards.
The remainder of the dashboards were written by another group and the code in my local repo was significantly outdated. What should I do now?
Fortunately, they also used Git to manage all of the code and their scripts were also deployable as a Chef cookbook. I pulled down the most recent code from GitHub, modified the cookbook’s Test Kitchen file to use a Vagrant box that I already had downloaded, and then ran another kitchen converge. In about 10 minutes I had an additional virtual machine running and the remainder of the dashboards were correctly displaying data.
While the Vagrant boxes were being built, I took a deeper look into resolving the issues with the existing servers. Ultimately, I was unable to connect to either server through our hypervisor console, meaning that our conventional restoration methods were unavailable.
##Next Steps
Having the automation already in place for these dashboards made the entire process much easier and greatly reduced the amount of time needed to restore functionality to our Operations Center. Through this automation, we were able to completely build two new ‘servers’ and restore functionality within an hour and a half of the outage’s start. This also provided us with an opportunity to have the original server issue resolved through normal processes without having to increase the priority or contact additional teams so they could remain engaged in guest-facing technologies.
While monitoring-as-code has already proven itself as a worthwhile investment, we foresee several other potential benefits:
- Anyone can contribute enhancements, upgrades, modifications. These are “living” monitors.
- We can easily try out new hosting environments and move our code from one private cloud to another.
- We have an additional disaster recovery option since we can essentially deploy our code to any available server.
Finally, in the spirit of DevOps and feedback loops, as a result of this experience, we would now like to automate more of the process so that our monitoring stack is self-healing. Ideally, when the alerts are generated indicating that data is missing, our infrastructure will automatically build and provision a new machine to run our scripts from until the original server becomes functional again.