One of the strongest benefits of launching an application into the cloud is the pure on-demand scalability that it provides.
I’ve had the privilege of working with the ELK stack (Elasticsearch, Logstash, Kibana) for purposes of log aggregation for the past two years. When we started at that time, we were pleased with our performance on search and query times with 10’s of gigabytes of data in the cluster in production. When Peak time hit, we reveled as our production clusters successfully managed half a terabyte of data(!).
During peak, Target hosted 14 Elasticsearch clusters in the cloud containing more than 83 billion documents across nearly 100 terabytes in production environments alone. Consumers of these logs are able to get access to queries in blazing fast times with excellent reliability.
It wasn’t always that way though, and our team learned much about Elasticsearch in the process.
What’s The Use Case At Target?
In a word, “vast.” The many teams that use our platform for log aggregation and search are often times looking for a variety of things.
- Simple Search
This one is easy, and the least resource intensive. Simply doing a match query and searching for fields within our data.
- Metrics / Analytics
This one can be harder to accommodate at times, but some teams use our Elasticsearch clusters for near-realtime monitoring and Analytics using Kibana dashboards.
- Multi-tenant Logging
Not necessarily consumer facing, but an interesting use for Elasticsearch is that we can aggregate many teams and applications into one cluster. In essence, this saves money over individual applications paying for infrastructure to log themselves.
Simple search is the least of our concerns here. Queries add marginal load on the cluster, but often they are one-offs or otherwise infrequently used. However, the largest challenge faced here is multi-tenant demand. Different teams have very different needs for logging/metrics; designing a robust and reliable ‘one-size-fits-all’ platform is a top priority.
A Few of Our Favorite Things
At Target, we make great use of open-source tools. We also try to contribute back where we can! Tools used for our logging stack (as far as this post is concerned) include:
- Elasticsearch, Logstash, Kibana (ELK stack!)
- Apache Kafka
- Hashicorp Consul
- Chef
- Spinnaker
In The Beginning…
When the ELK stack originally took form at Target, it was with Elasticsearch version 1.4.4. While we have taken steps to manage and update our cluster, our underlying pipeline has remained.

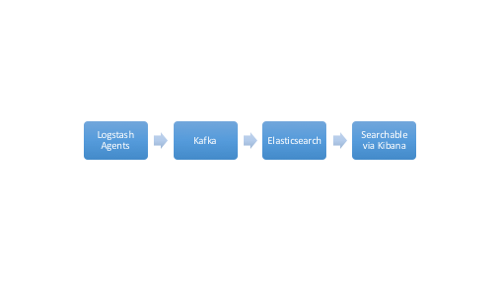
To get logs and messages from applications, we have a Logstash client installed to forward the logs through our pipeline to Apache Kafka.
Kafka is a worthwhile addition in this data flow, and is becoming increasingly popular for it’s resiliency. Messages are queued and consumed as fast as we can index them via a Logstash consumer group and finally into the Elasticsearch cluster.
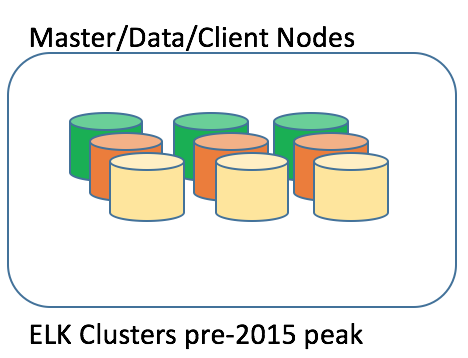
While we were impressed and happy with our deployment, the initial Elasticsearch clusters were simple by design. A single node was responsible for all parts of cluster operations, and we had clusters ranging from 3-10 nodes as capacity demands increased.

The Next Step
The initial configuration did not last very long; Traffic and search demands rose with increased onboarding of cloud applications, and we simply could not guarantee reliability with the original configuration.
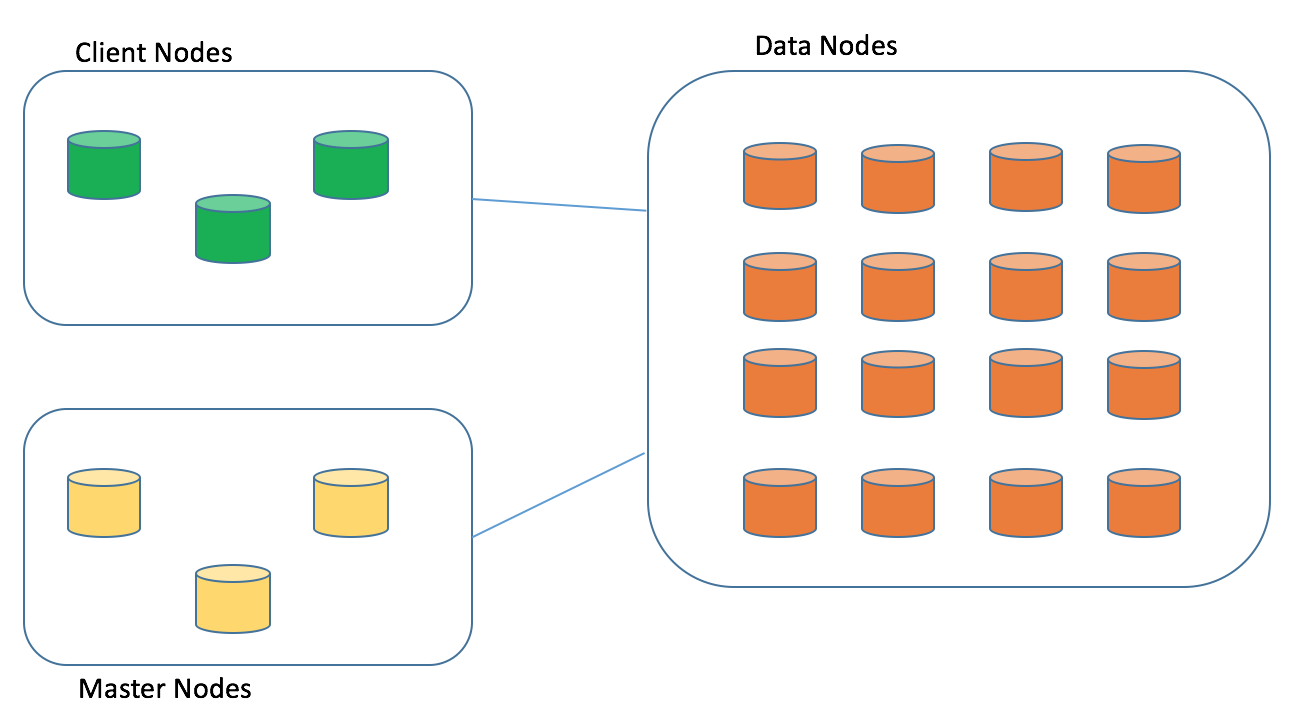
Before our peak season in 2015 we unleashed a plan to deploy the universally accepted strategy of using dedicated master, data, and client nodes.

Separating out the jobs (Master, Client, Data) is a very worthwhile consideration when planning for a scalable cluster. The main reason is that, when running Elasticsearch, heap size and memory is your main enemy. Removing extra functions from the process and freeing up more heap for a dedicated job was the single most effective thing that could be done for cluster stability.
Deployment strategy
With the initial cluster, we used a Chef pipeline tied into the cloud by an in-house developed deployment platform. For the 2016 season, we ended up shifting to a deployment pattern that moved away from cookbooks and Chef completely, instead being replaced with an RPM styled deployment via Spinnaker.
RPMs were a huge turning point for the team. The average time to build an Elasticsearch data node, especially one with HDDs, was above 15 minutes with Chef. Emergency adjustments and failures were hard to respond to with any speed. Deploying an RPM via Spinnaker, we were able to deploy the same image to the same instance types in less than 5 minutes; Instances with SSDs would be active in even less time than that.
Spinnaker made deployments dead simple to provision, entire environments with all the components could be set to trigger at the press of a single button, a welcome change from the unfortunately delicate and time-consuming process that it replaced.
Yet another major change for us was segmenting out high-volume tenants. Spinnaker made this much, much easier than it could have been with our system we had with Chef, but the real star of this show is Hashicorp’s Consul. Our team was able to stand up logging clusters for tenants and shift the log flow to the correct clusters seamlessly and with no impact to our clients using consul-templates and Consul key/value stores.
Our Final Form?
Elasticsearch at Target has gone through some changes since our Peak season in 2015. We now utilize Elasticsearch 2.4.x in production, enhanced Logstash configurations, and highly scalable, dynamic clusters. Much of this has been made possible with Hashicorp’s Consul and use of their easily managed Key/Value store.
We also broke out and experimented with Data node types. Using a system of “Hot/Cold” we have been able to save on infrastructure costs by swapping older, less searched data to HDD, and keeping fresh, often searched data on SSD storage.
As stated before, during peak holiday load, we dealt with over 83 billion docs in our production environments, and a single production cluster often hosts over 7500 shards at a time. Our indices are timestamped by day, such that we can easily purge old data and make quick changes to new data.
Deployment strategy changes were key. Our logging platform endured the 2016 holiday peak season with 100% uptime. On-call schedules were much easier for us this year!
Some Lessons Learned
- Again, RAM/Memory is the main enemy. A cluster will frequently run into Out of Memory errors, GC locks, etc. without a good supply of heap.
- Dedicated Masters. Just do it. It’s passable to combine Kibana/Client nodes, or Data/Client nodes in small environments, but avoid this pitfall and just dedicate masters for ELK.
- 31gb is a good heap size for your data nodes. 32gb heap will force 64-bit JVMs, not efficient for this purpose.
- Using Elasticsearch plugins, such as Kopf, will make your life visibly easier. (Mind, this isn’t supported out of the box if you go with Elasticsearch 5)
- Get a cheat sheet together of your most frequently used API commands. When setting up a cluster, chances are good you will be making frequent tweaks for performance.
- Timestamp your indices if your traffic is substantial, reindexing to allow for more shards is painful and slow.
- Consumers of your logs (customers) aren’t always right, be mindful of logstash configurations on forwarders to avoid indexing errors in Elasticsearch.
In Closing
Final form? Of course not! There’s always more to do, and our team has some exciting things planned for the future of logging and metrics at Target.
About The Author
Lydell is a Sr. Engineer and all-around good guy, most recently working with the API Gateway team at Target. When he’s not tinkering with the gateway, you can probably find him playing with his band (Dude Corea), playing the latest video game, or trying to skill up his Golang abilities.