Target’s open source big data platform contains a vast array of clustered technologies or ecosystems working together. Troubleshooting an issue within a single ecosystem is a difficult task let alone an issue that spans several ecosystems.
It is impractical for a single human to individually investigate ecosystems one at a time for potential problems. The house will burn to the ground long before an engineer can find the cause of an issue and resolve it without quick access to aggregated system metrics and logs.
The Solution
How to identify, troubleshoot and resolve a distributed issue? Fight fire with fire of course! Big data issues must be solved with big data solutions.
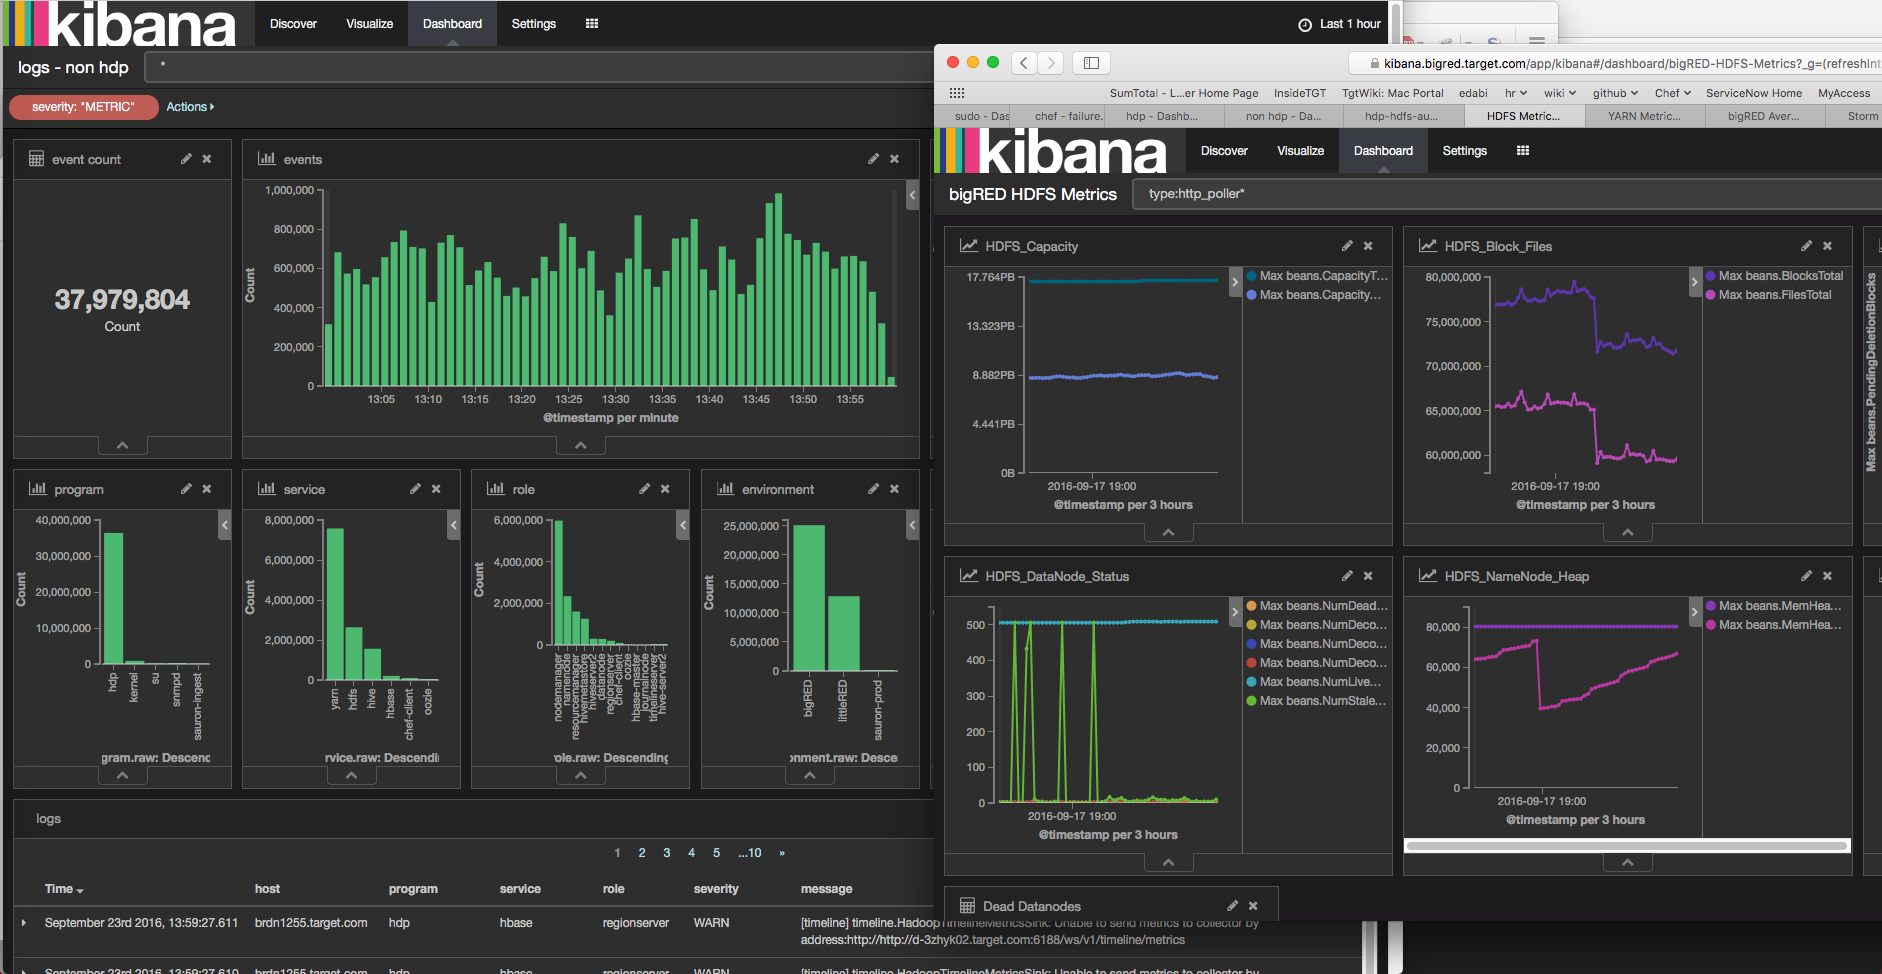
At Target, we are constantly expanding our Distributed Troubleshooting Platform to encapsulate every log and metric from every service in every ecosystem of our big data platform. Aggregating this data into a single troubleshooting platform enables an engineer to view error logs and system metrics across hundreds of machines and services with a single click.
A troubleshooting platform like the one described above is not a new idea. Systems like Splunk have been doing it for years. Splunk however, has restrictions on the amount of data that can be ingested without an enterprise license. The larger we scale; the more money we pay for systems like Splunk.
We created our Distributed Troubleshooting Platform from open-source components and without enterprise licenses. This allows us to utilize it on every server in the big data platform without worrying about the volume of data it is processing and re-negotiating enterprise licenses. It becomes a given, not a variable.
Our Distributed Troubleshooting Platform is similar to the black box recorder on an aircraft. A majority of the time, the contents are never viewed. When the plane crashes however, the contents of the black box are the only way to reconstruct what happened and learn from the incident.
Running a big data platform without enterprise licenses comes at a cost. There is no enterprise support or “throat to choke” if something goes wrong. Having all the system metrics and logs available as quickly as possible becomes crucial to resolving the issue quickly.
The Distributed Troubleshooting Platform at Target
We chose the Elasticsearch, Logstash and Kibana stack (what was the ELK Stack is now the Elastic Stack). The Elastic Stack out of the box does not do a whole lot, but what it provides is a bottomless toolbox of components to build anything imaginable.
For those not familiar with the Elastic Stack, here is a brief description of the key components:
- Elasticsearch – A pluggable horizontally scalable distributed search engine based on Lucene.
- Logstash – A pluggable ingestion, transformation and publishing tool.
- Kibana – A pluggable discovery and visualization dashboard Node.js webserver.
The keyword in all of the above is pluggable. The Elastic Stack components are great out of the box but when augmented with various home brewed plugins and the incredible availability of community plugins, they become unstoppable.
Requirements
The requirements for our Distributed Troubleshooting Platform:
- Enterprise license-free
- Able to ingest and visualize any log of any type
- Able to ingest and visualize any metric of any type
- Deployment must be automated
- Highly-available and horizontally scalable
- Secure, end-to-end SSL and authorization (Search Guard, an open-source, pluggable security suite for Elasticsearch that does not require an enterprise license)
Enough talk, time for a real world example
The problem – our Distributed Troubleshooting Platform worked great up until about 600 servers were sending data to it. Amongst these servers were Hadoop services, MySQL, Storm, Elasticsearch, Chef and a whole host of other services.
The Elasticsearch cluster handling the events was increasingly dropping events for every new node added to the big data platform. At first this was not concerning because a majority of the events were still flowing enough to troubleshoot and fight fires.
We started hooking up Nagios to our Distributed Troubleshooting Platform to monitor service metrics and immediately noticed a problem. The data quality of the service metrics was poor. Although they were still good enough to look at from a one-hour view in Kibana, they were not sufficient for notifications. There were random gaps in the data, sometimes as large as 10 minutes. These gaps would trigger false alarms from Nagios.
Getting to the bottom of the Issue
The natural place to start is at the Logstash level. It seemed as if Logstash was not configured correctly or the events would not be dropping. Numerous iterations of Logstash configuration changes yielded little to no improvement in dropped events. The issue was growing worse by the day. Without any metrics on the Elasticsearch cluster, the only scientific validation of the Logstash changes would be whether or not the events were still dropping.
Not very scientific, but being an engineer, I had 100 other things to do than instrument Elasticsearch, which up until this point had never given me a problem.
After countless failed attempts to figure out the issue with Logstash, I decided it was time to instrument Elasticsearch. I needed better instrumentation to see what the true impact of each change was on the system. Guessing was not working.
Instrumenting Elasticsearch
I wanted to know absolutely every metric for Elasticsearch if I was going to solve this once and for all. The following endpoints provided what I needed:
- https://localhost:9200/_nodes/stats
- https://localhost:9200/_cluster/stats
- https://localhost:9200/_cluster/health
Here is a small example snippet of some data I was interested in from one of the above endpoints:
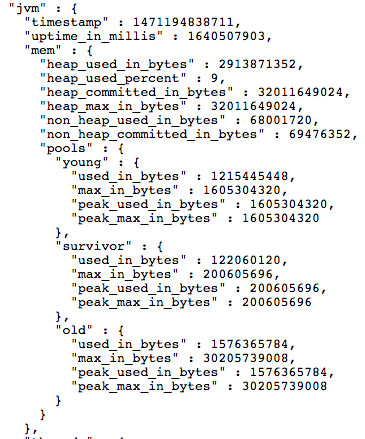
Those endpoints contain parent-child relationships. Similar to the JVM metrics above. Kibana does not like parent-child relationships. I cannot ingest the JSON natively because of this. Those endpoints also contain 100+ other metrics I was not interested in. It would introduce a monsoon of fields into the Distributed Troubleshooting Platform to ingest the entire endpoint JSON natively without pruning the contents.
I needed to pull out the bits and pieces I was interested in, flatten out the JSON and combine the three endpoints into an uber JSON document. This provides a single document containing a snapshot of all important metrics for a given moment.
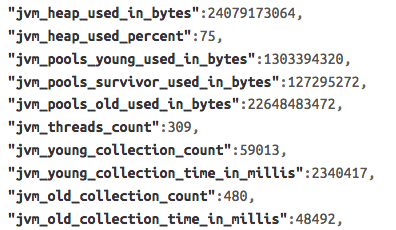
Here is the same data (only the bits I cared about) from above flattened out into something Kibana work with:
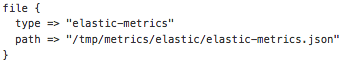
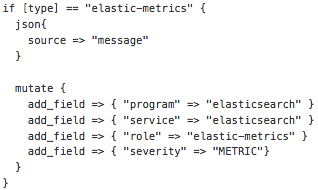
Since I was emitting JSON documents, which my friend Logstash loves, ingesting them to Elasticsearch was trivial:
The elastic-metrics Dashboard
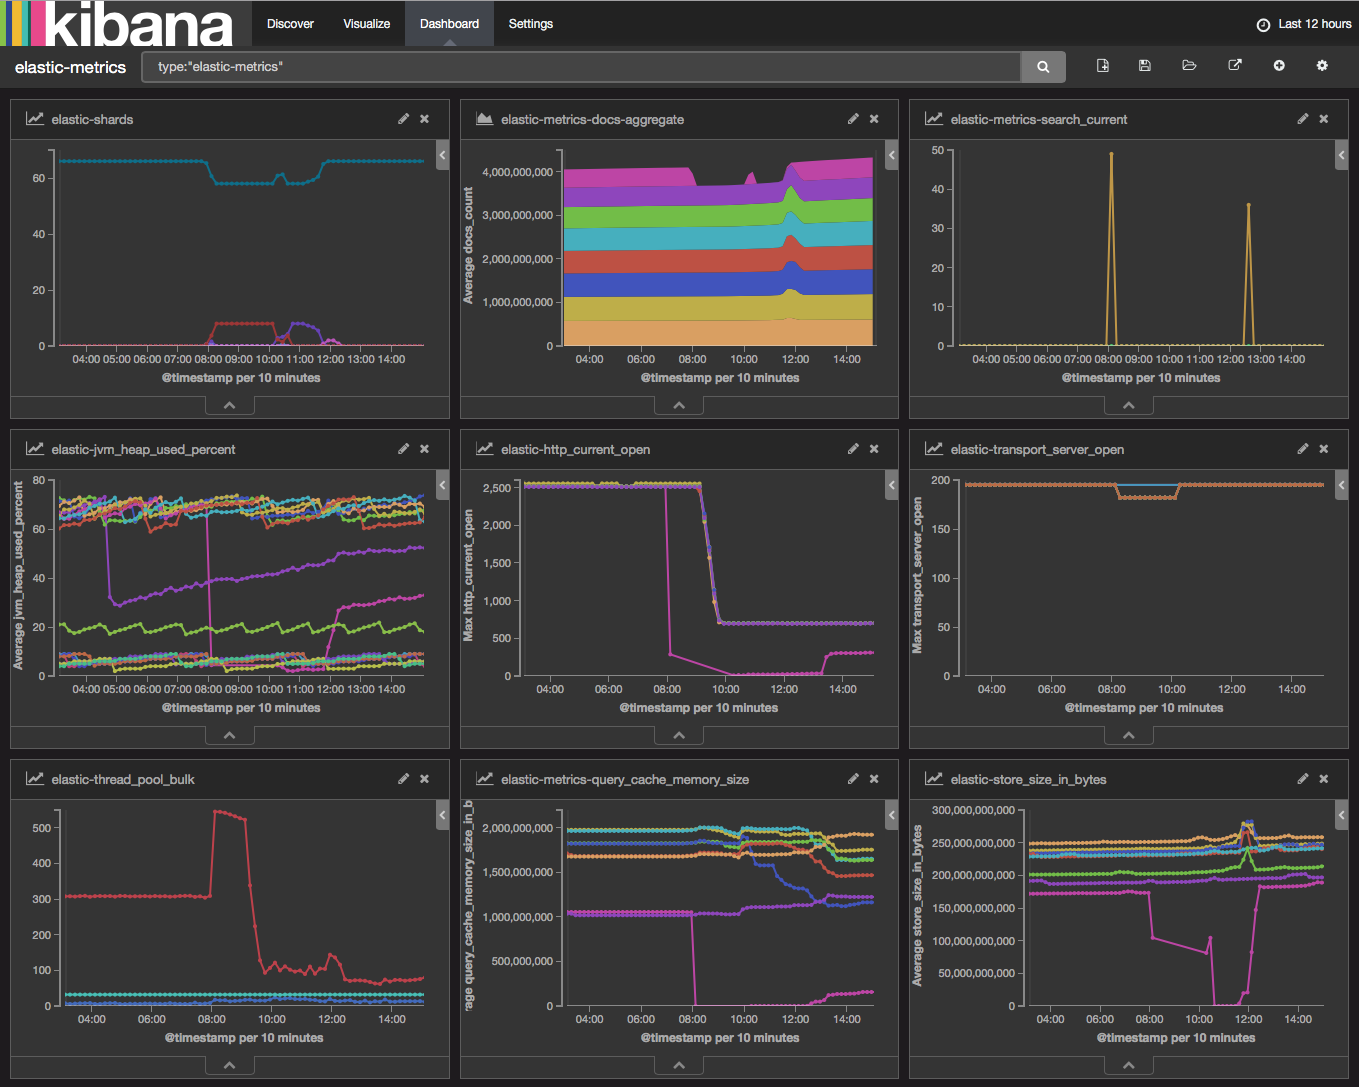
Almost immediately I saw what I thought was the problem. I looked at the “elastic-thread_pool_bulk-host” visualization and saw the bulk queue for one of my Elasticsearch servers was 2,500 bulk events deep while the rest were hardly 20. Like any engineer I restart that instance and think “yeah there we go, must have been a glitch with that instance”. The restart of that server can be seen as the bright pink line that drops off around 8:00am in various charts above.
To my great disappointment, I made the problem even worse. The aggregate bulk queue length sky rocketed.
The bulk queue being backed up is a symptom, not the problem.
Back to the elastic-metrics dashboard to look for anything else that did not make sense. I turn my attention to the “elastic-http_current_open” visualization. I notice something odd. I should not have 2,500 HTTP connections to the Elasticsearch cluster. We had at that time about 600 nodes using the Distributed Troubleshooting Platform. I should have about 600 HTTP connections.
Turns out, one of my pre-mature optimization choices for the number of Elasticsearch output workers (4) in a Logstash agent was quadrupling the number of HTTP sessions coming from every node. Instead of one large bulk request with up to X number of events, each agent was sending 4 smaller bulk requests of X/4 events.
I quickly pushed out a change to every server in every ecosystem without failure with my good friend Chef. The change adjusts the output workers to 1 and bumps the batch size from 1000 to 5000. I get 3 less workers (3 less HTTP connections) and 1000+ max events per agent with this new configuration. Excellent.
Immediately I start to notice the HTTP sessions lowering around 10:00am and ingest starting to pick up. Dropped events are happening less and less. The bulk queue is going down. Time to get some beers.
Scaling a distributed system is hard and full of mistakes
Way back when we had just a handful of servers, I figured why not have more than one Elasticsearch output worker on my Logstash agents. I want MORE POWER all the time! This scaled great until it did not.
Every node added to the Distributed Troubleshooting Platform was as if we added four clients to Elasticsearch.
I successfully used the Distributed Troubleshooting Platform to troubleshoot why Distributed Troubleshooting Platform was not working.
Log aggregation and service metrics in an open-source big data platform are invaluable when running without enterprise licenses and enterprise support contracts. Engineers need a platform that is quickly augmentable, expandable and configurable to stay on top of all the various technologies and their quirks. There is no enterprise support to call when something goes wrong. The big data engineers own the platform and are held responsible for it when something malfunctions. Creating a ticket for enterprise support and making it someone else’s problem is not an option.
We solve issues in our ecosystems like the one described here on a daily basis thanks to the Elastic Stack and a bit of elbow grease from our engineers. Our Distributed Troubleshooting Platform currently has ~250 service metrics and ~40 different log types being ingested at ~1TB per week un-replicated.